A user can also perform the following operations on the NetHavoc window:
Show All Havocs
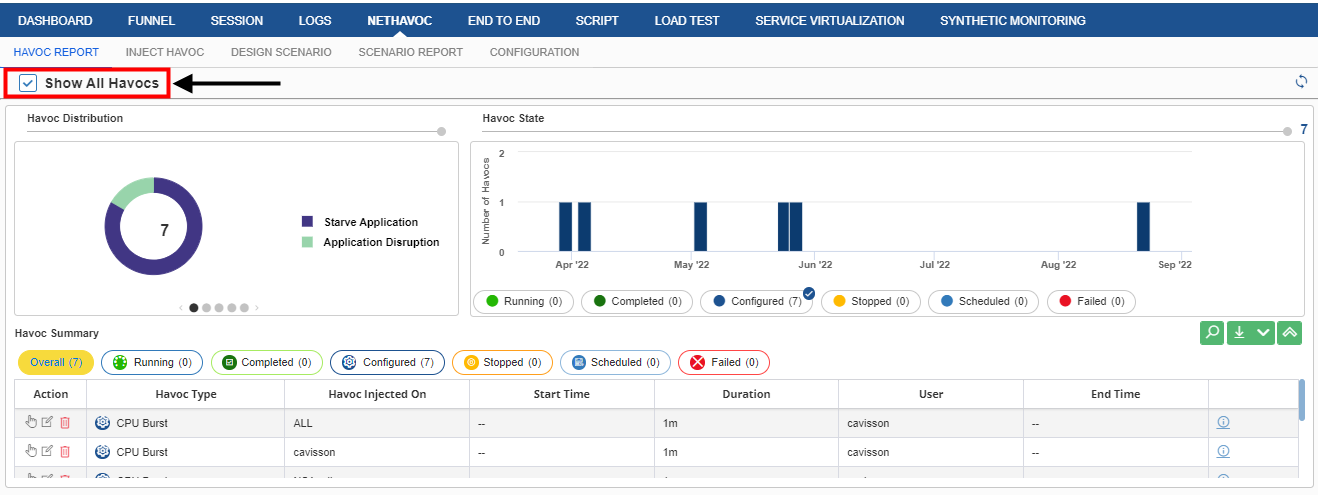
A user can view all the havocs that are in the ‘Ready to Apply’ or ‘Running’ or ‘Scheduled’ state in any test run. To view all the havoc, select the Show All Havocs check box at the top of the window.
Figure 68: Show All Havocs
Auto Refresh
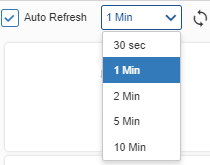
A user can use this option to auto-refresh the NetHavoc UI. Upon doing this, the changes are reflected across all users using the same machine.
To do this, select the Auto Refresh check box at the top of the window, and then select the desired time interval for auto-refresh from the drop-down list. The available options are:
30 seconds
1 minute
2 minutes
5 minutes
10 minutes
Figure 69: Auto Refresh
Time Period
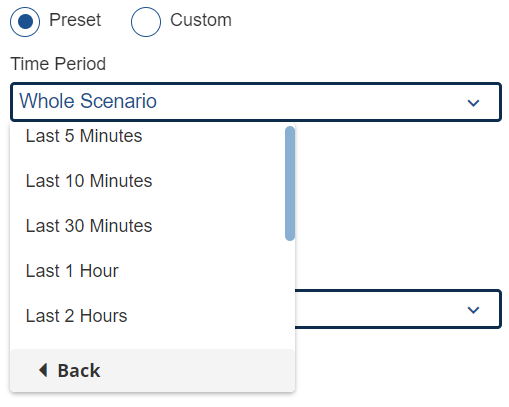
A user can select the period for which the data should be displayed on the NetHavoc window. To do this, select the time period from the drop-down list at the upper-right corner of the window. The available options are:
Last 5 Minutes
Last 10 Minutes
Last 30 minutes
Last 1 Hour
Last 2 Hours
Last 4 Hours
Last 6 Hours
Last 8 Hours
Last 12 Hours
Last 24 Hours
Custom
Figure 70: Time Filter
Once a user specifies changes the default time period (that is, 4 hours) to a new one (for example, 24 hours) and traverses out from NetHavoc UI to another UI (for example, Dashboard), and after a while traverses back to the NetHavoc UI, then the set period (24 hours) is maintained and reflected in NetHavoc UI.